My Life Story
Data Visualization using Power BI
In this project I have created an interactive dashboard using Power BI to give a brief introduction of myself and and my journey
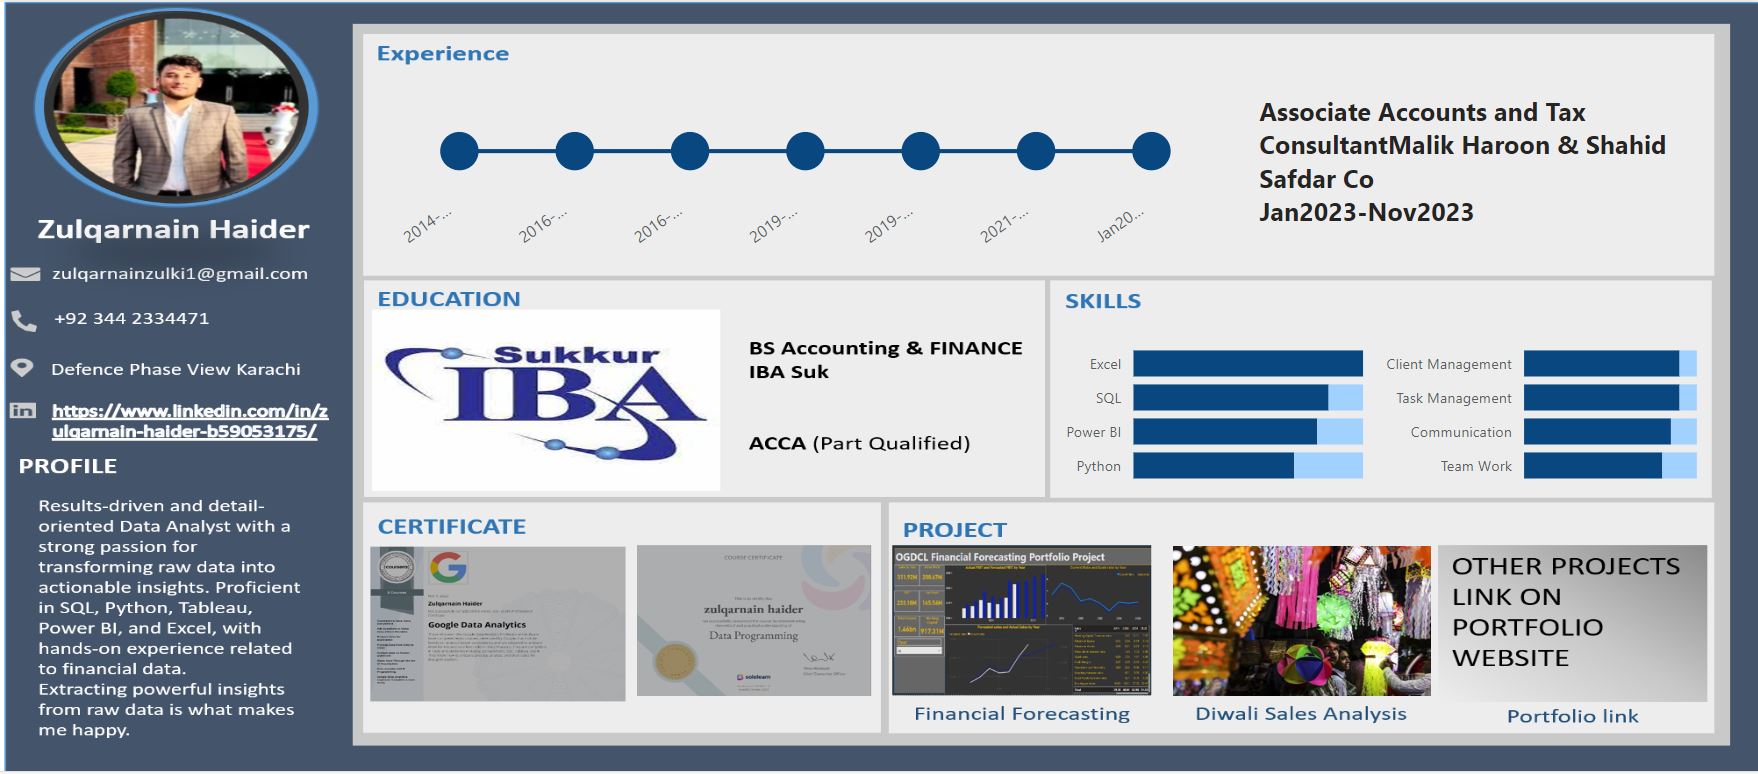
A full time data analyst having experties in SQL, Python, Power BI, Excel & R. Check profile@Zulqarnain.linkedin kaggle account kaggle
to see my portfolio and the details of projects.
In this project I have created an interactive dashboard using Power BI to give a brief introduction of myself and and my journey

Used Python language and libraries to analyze and get important trends and insights from diwali sale data on kaggle.
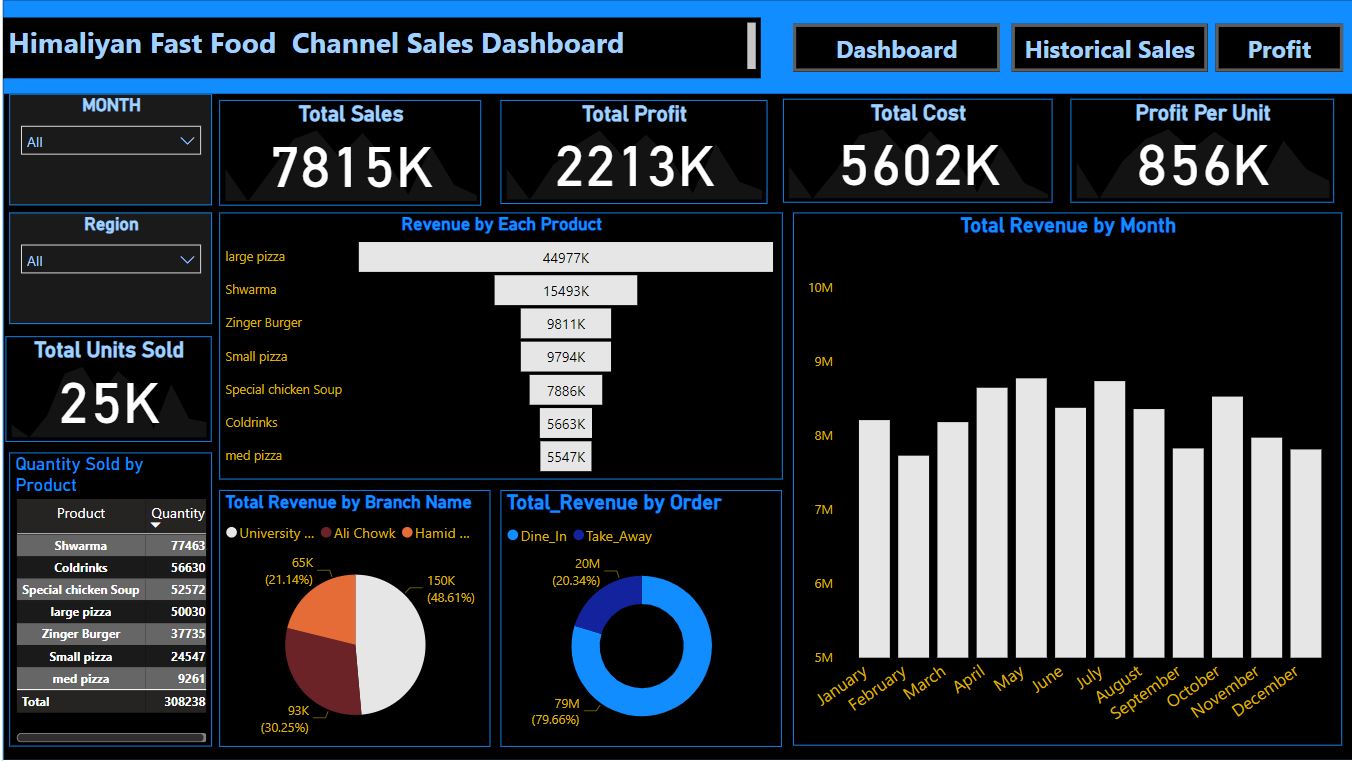
In this project I created an interactive and attractive dashboard to highlight the important KPIs to the non-technical users and management.

In this project I have cleaned up the data downloaded form source using MYSQL and note some important KPIs.

A Python project to create a train test split and use Regression Models and correlation to test for the data.
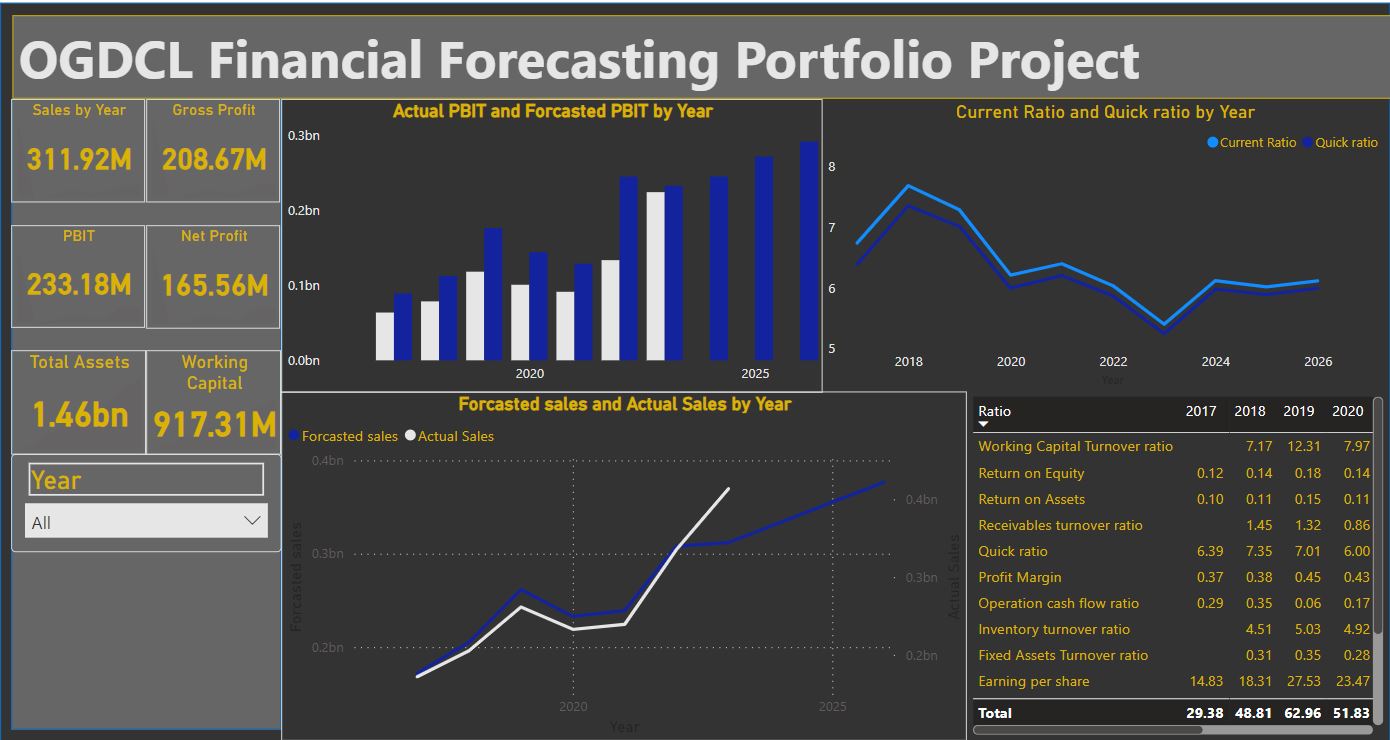
Downloaded the 5 year Financial Statements of OGDL company and collect information from deferent sources and predict the financial Statement for next 5 Years using financial models.

In this project I use Tableau to visualize the insights from Noise complain dataset and created a dashboard.

.